Microstructures of Metamorphic Rocks
Crystal size distributions
The crystals in a metamorphic rock show a range of sizes, and we can illustrate the distribution of grain sizes on a histogram. In practice we measure the diameters of grains in sections through the rock, and allowance must be made for the fact that not all grains are cut through their centres.
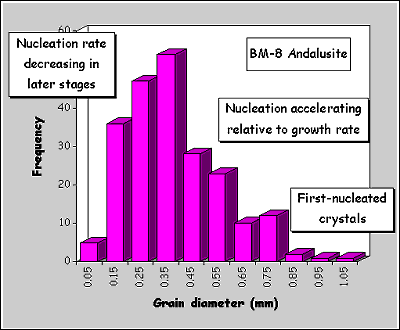
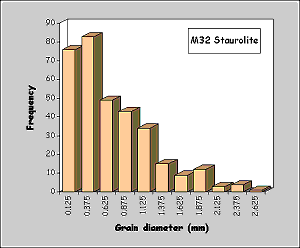
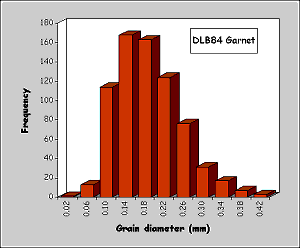
In general, we expect that the grains which nucleated earliest will have grown to the largest size. To a first approximation the diagram can be read, from right to left, as a record of the nucleation rate through time.
Two further examples illustrate the range of patterns seen:
|
Relatively large crystals, with a maximum frequency near the small end of the range. |
Relatively small crystals, with a maximum near the middle of the range. |