Microstructures of Metamorphic Rocks
Analysing crystal size distributions
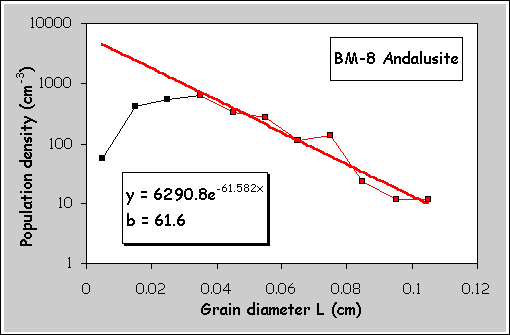
Since the nucleation rate is so sensitive to overstepping, the shape of the crystal size distribution is dominated by the changes in nucleation rate with time. In most examples, the right-hand tail of the distribution, reflecting the initial acceleration of the nucleation rate, looks like an exponential function.
Plotting ln(n), where n is the population density, against the grain diameter L generally produces a straight-line relationship
n = n0.e-bL

The principal controls on the nucleation-growth interaction are
- the critical overstepping required for nucleation
- the rate of crystal growth (controlled by interface growth or by diffusion to growing grains)
- the rate of heat supply to the rock
These factors determine the initial acceleration of nucleation rate, measured by the parameter b. Large b corresponds to many small crystals, and small b to scattered large porphyroblasts.
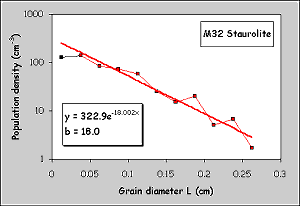
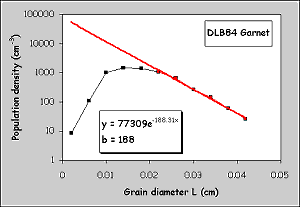
Here are plots for the other two examples, showing variation in the value of b for different minerals in different settings.
|
M32 Staurolite. b = 18.0 |
DLB84 Garnet. b = 188 |

